It is not just a simple measurement tool, but a strategic, end-to-end project aimed at building agricultural resilience over the long term and generating real, economic value.
The solution covers the entire cycle: from the initial map creation to sampling, certification and final reporting.
An integrated support system in every phase of the soil life cycle: managing the entire process reduces the number of physical samples required by up to 10 times compared to traditional methods, increasing data accuracy.
01
Analysis e A.I.
Laboratory results are automatically uploaded to the platform and integrated with biological indicators recorded in the field, such as soil structure evaluation (VESS) and biodiversity (e.g., earthworm counts).
03
Soil Mapping
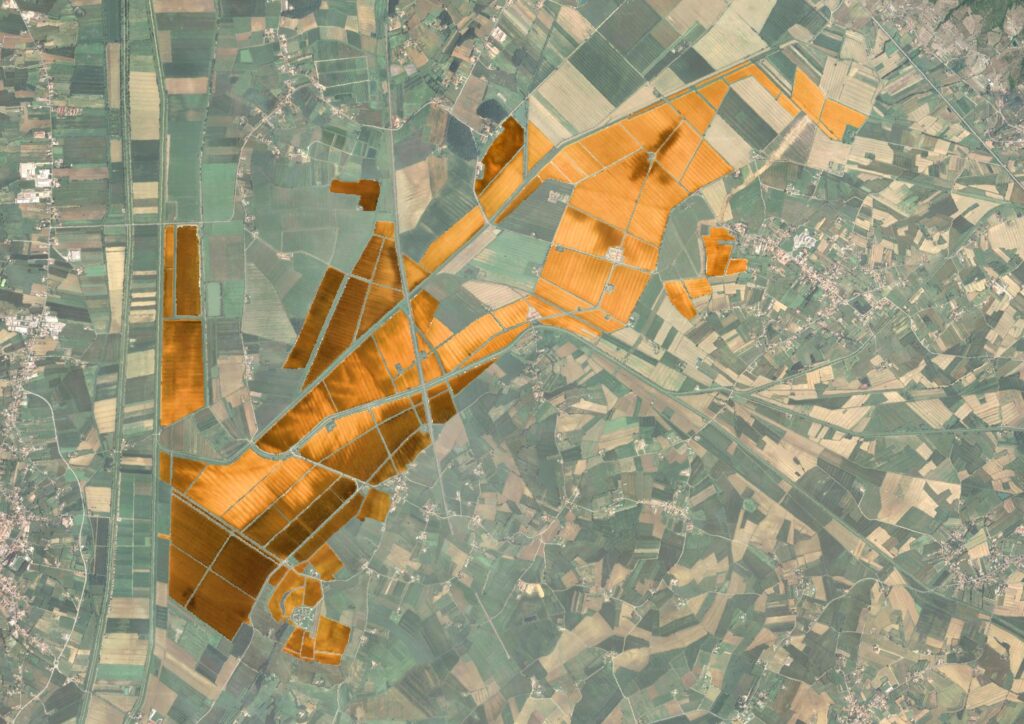
Use of satellite data and advanced biophysical models to identify Homogeneous Management Zones (MUZ). This overcomes traditional uniform sampling, allowing for variable rate interventions for seeds and fertilizers.
02
Certification and Reporting
Creation of analytical and descriptive reports that act as a Decision Support System (DSS). The documentation meets ESG certification requirements, carbon credits and the transparency demanded by supply chains.
04
Smart Sampling
The system guides the operator in identifying optimal sampling points. The samples collected are digitally tracked via GPS from collection to laboratory analysis.
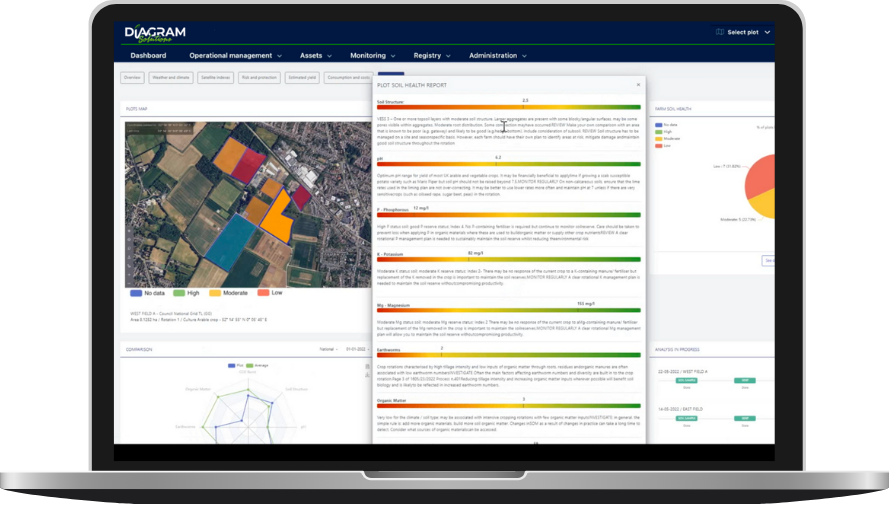
A customizable soil health index, based on priority parameters for each supply chain, provides a clear and immediate overview of soil status, enabling informed decisions to improve fertility and resilience.
Monitoring
Offers a comprehensive approach to monitoring and improving soil conditions through a combination of physical, chemical, and biological analyses.
Methodology
Surface soil samples, taken at georeferenced points via GPS, are sent to the laboratory for pH, extractable nutrients (including P, K, and Mg), organic matter and microbial activity (CO₂-burst) analysis.
Reporting
A Visual Soil Structure Evaluation (VESS) and earthworm count are carried out to analyze soil structure and biodiversity. Laboratory results are automatically uploaded to the SHSC and integrated with field data, generating a detailed report.
Digital scorecard
A visual traffic light system classifies parameters and provides operational guidelines to improve specific aspects of soil health, allowing monitoring of its evolution over time.